Know the content and how to teach it
AITSL Standard 2.5
Focus Areas
- Teaching and modelling of grammatical and English language conventions
- Teaching/modelling of appropriate numerical conventions
- Explicit teaching of the language of a content discipline
- Planning and teaching of activities that improve the language, literacy and numeracy of students
Description
Some of my year 8 Geography class students had lower literacy and numeracy abilities. To help them improve, I organised a special activity on the unit of Urbanisation, which prompted creative thinking and required understanding definitions and concepts and performing numerical calculations. The activity was spread into three lessons, so that I could scaffold students’ understanding. In the first, I explained the concept of a choropleth map and provided PowerPoint examples of such maps, measuring different things, so that they could grasp how to visually interpret the information (Slider 2.3). In the next lesson, I asked them to measure the “population” in the library’s rooms and then calculate the “population density” using a supplied floor plan, accompanied with detailed instructions catered to the weaker students (Picture 2.4). Some students still struggled with the calculations; therefore, in the final lesson, I revisited the definition of “population density” and presented more examples on how to measure it (Picture 2.5). My action was informed by Nuthall (2000), who supports that it takes three or four experiences involving interaction with relevant information for a new knowledge construct to be transferred to long-term memory. At the end, students handed in their work (Slider 2.4) and I assessed their progress and level of understanding.
References
Nuthall, G.A. (2000). The role of memory in the acquisition and retention of knowledge in science and social studies units. Cognition and Instruction, 18(1), 83-139. doi: 10.1207/S1532690XCI1801_04
Evidence Artefacts


Slider 2.3: Slides from a PowerPoint presentation activating and promoting literacy and numeracy skills: 1) What is a choropleth map? 2) What do choropleth maps show and how can we interpret them? 3) Concrete example on how to interpret a choropleth map.
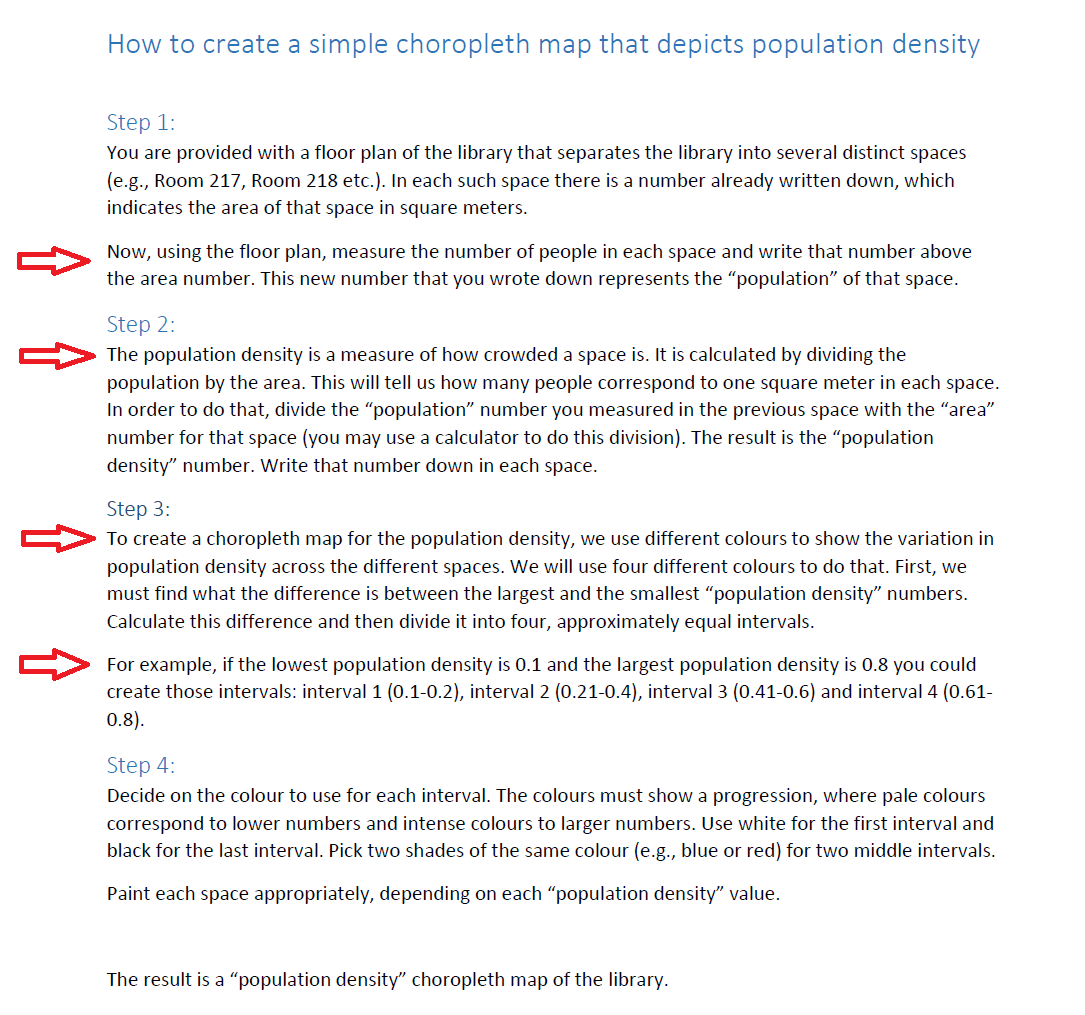
Picture 2.4: My reflection after the discussion with my mentor on students’ profiles.
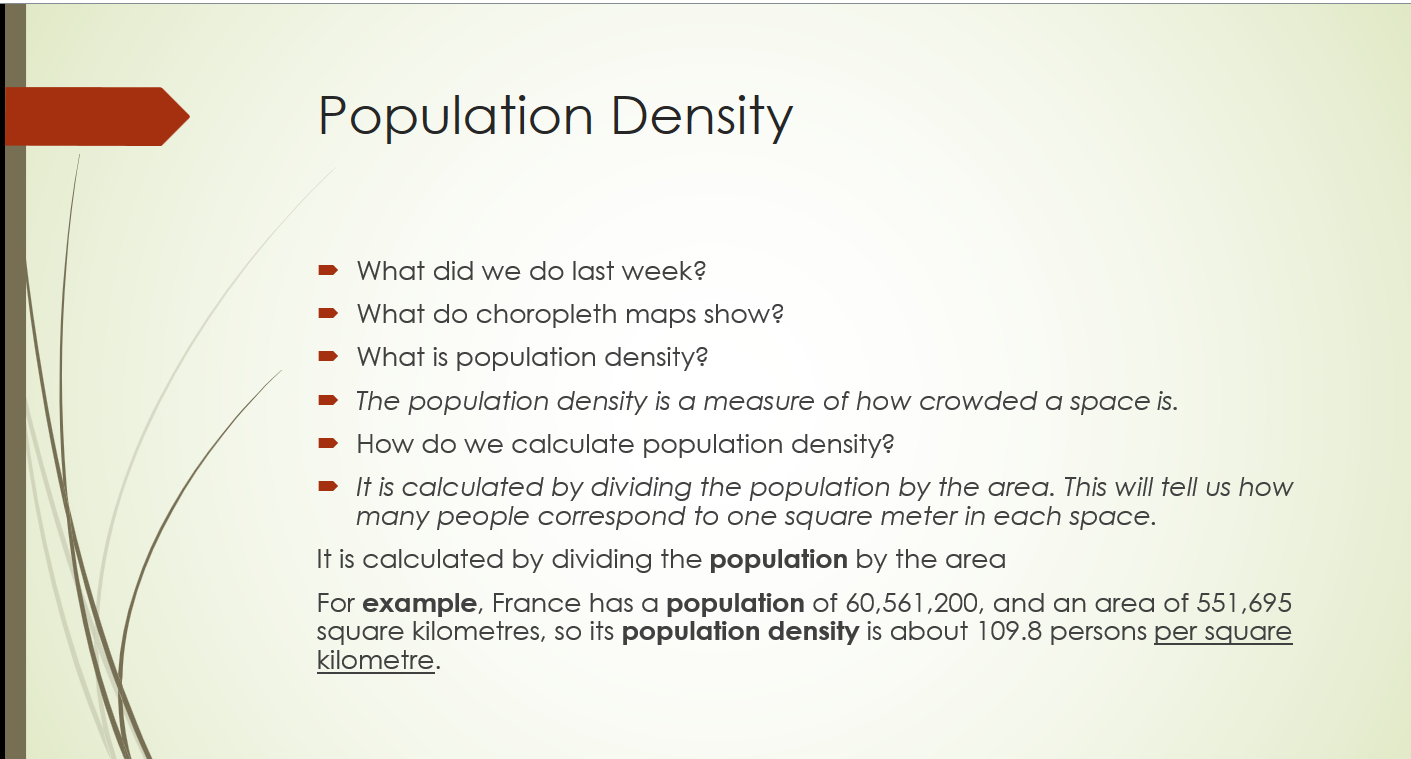
Picture 2.5: Stressing definitions to enhance literacy skills through a Powerpoint Presentation.


